Leoflow UI Walk — Verified Findings
Date: 2026-05-23
Method: The live demo stack (docker compose --profile demo up) driven by a
headless Chromium (Playwright, dockerized). Authenticated via the _token
cookie, navigated the screens by clicking (not deep-linking — direct
navigation to client routes like / 404s in the SPA), screenshotted each, and
captured console errors + non-2xx requests. Every screenshot below was inspected
and every finding cross-checked against the authoritative _private_ui.yaml
(3.2.1) — so this supersedes the earlier external audit where the two disagree.
Why no side-by-side with real Airflow for most screens: Leoflow serves the unmodified Airflow 3.2.1 SPA, so the layout/chrome is Airflow's. A real-Airflow comparison only adds value for data-shape differences; it is worth doing specifically for the empty Graph view (below).
Summary
The DAG list and grid render with full fidelity — including the run
state colors and the per-DAG fields the earlier external audit wrongly told us to
strip. The graph view renders an empty canvas (top bug). A few /api/v2
endpoints the UI polls still 404, and the Overview "Failed Runs" widget
miscounts.
Screens
DAG list — ✅ renders correctly
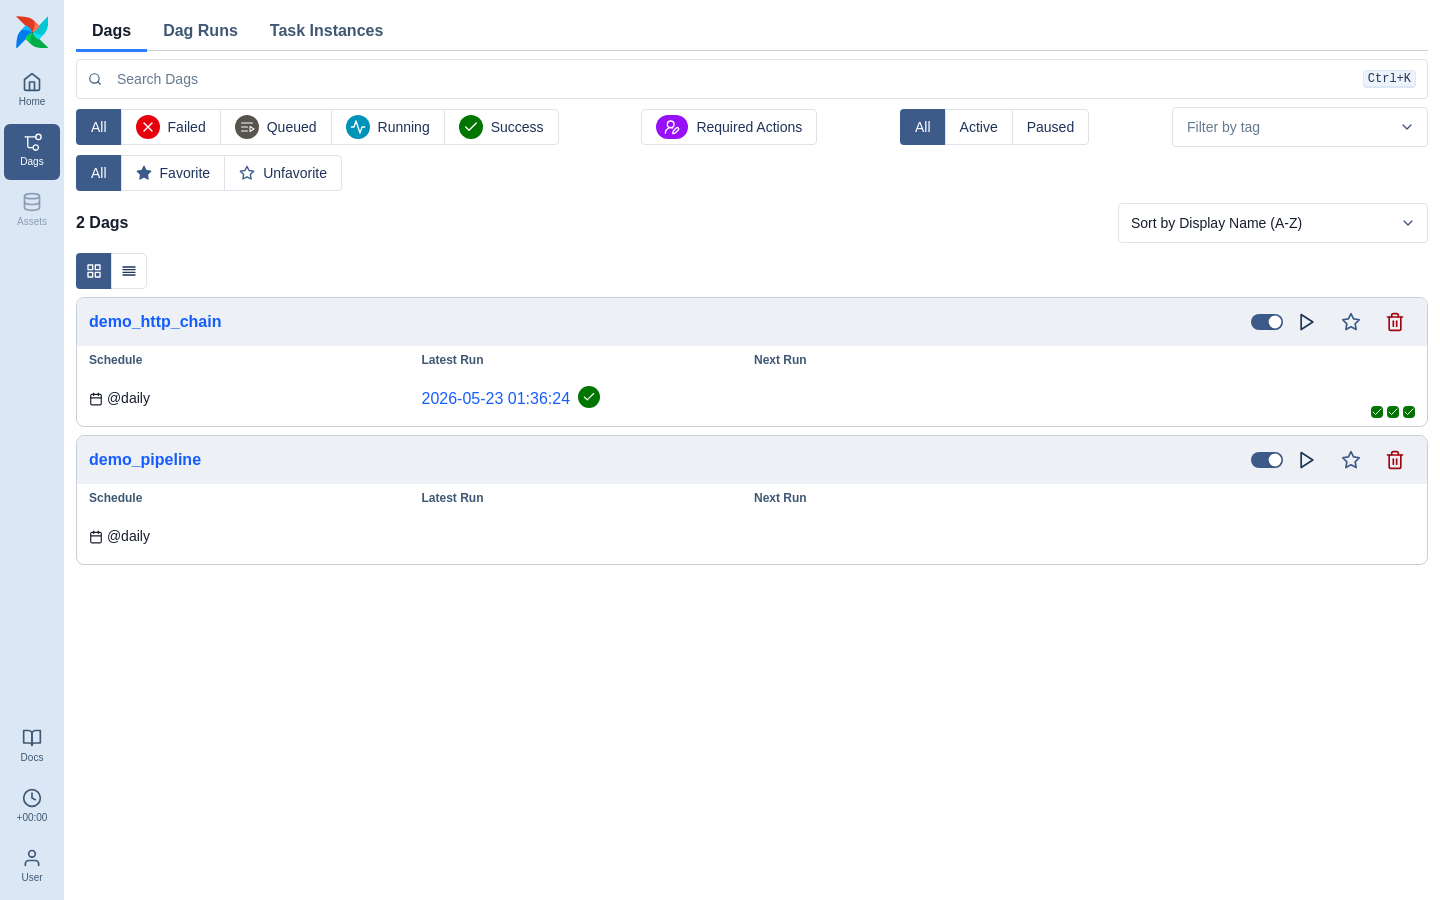
demo_http_chain shows schedule @daily, the latest run with a green check, and
three green run squares (its 3 successful runs); pause/trigger/favorite/delete
controls render. The filter chips (Failed/Queued/Running/Success), tags filter,
and sort all render. This directly refutes the external audit's "strip
description/bundle_version/next_dagrun_*/start_date/end_date from
/ui/dags" recommendation — those fields are required by the 3.2.1 schema and
the list renders correctly with them present.
Grid view — ✅ renders correctly
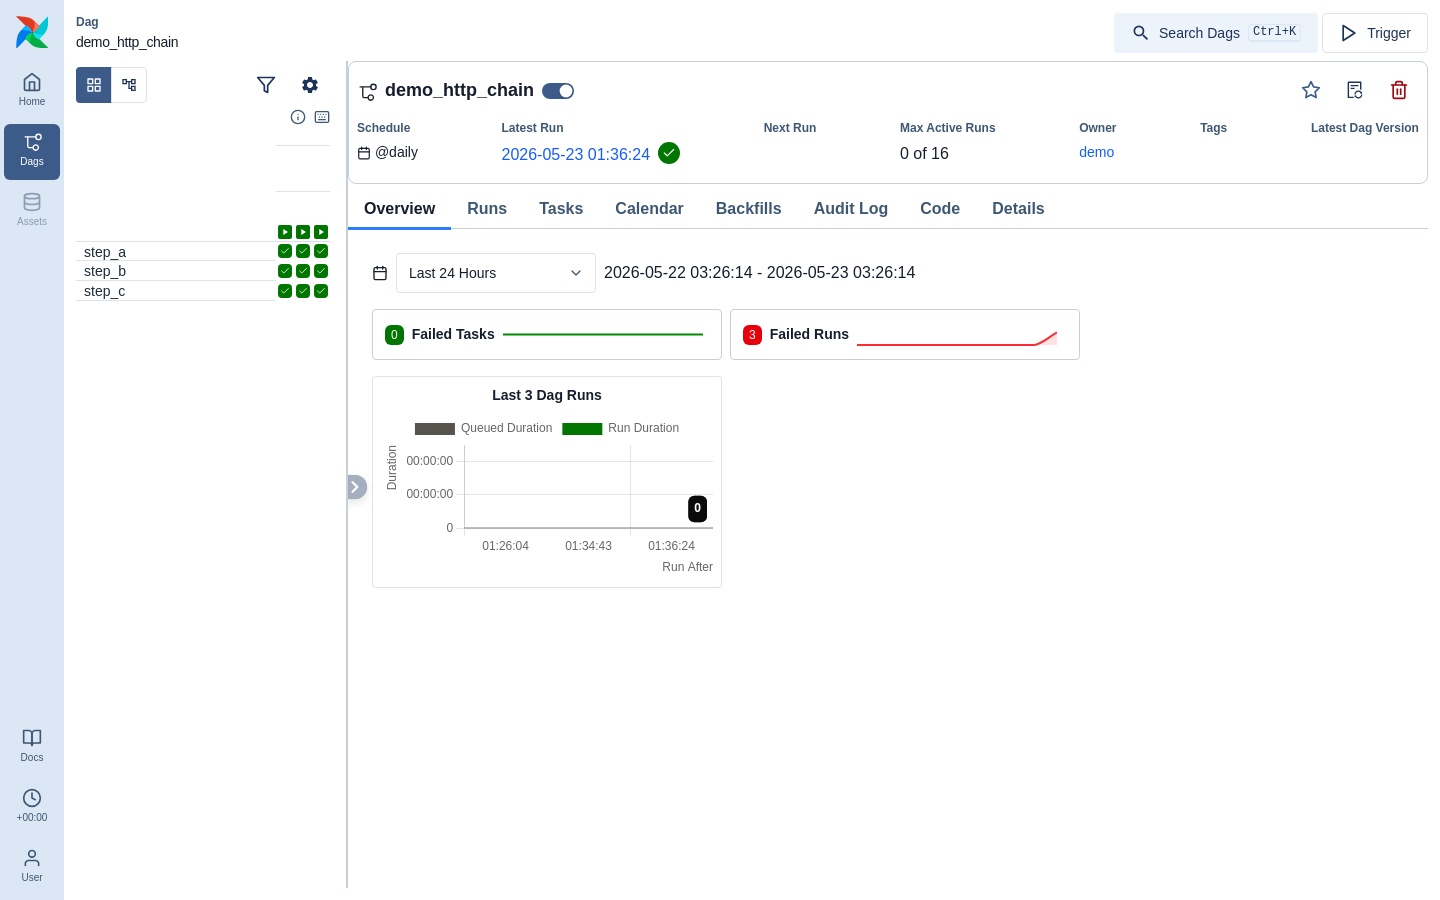
step_a/step_b/step_c each show three green ✓ cells (3 successful runs). The DAG
header (schedule, latest run, max active runs, owner) and the tab bar (Overview /
Runs / Tasks / Calendar / Backfills / Audit Log / Code / Details) render. The grid
left column is driven by /ui/grid/structure (incl. the required is_mapped) and
the cell colors by /ui/grid/ti_summaries — both correct. The external audit's
"Grid broken" applies only to mapped tasks / task groups, which the MVP does not
model; for normal DAGs the grid is correct.
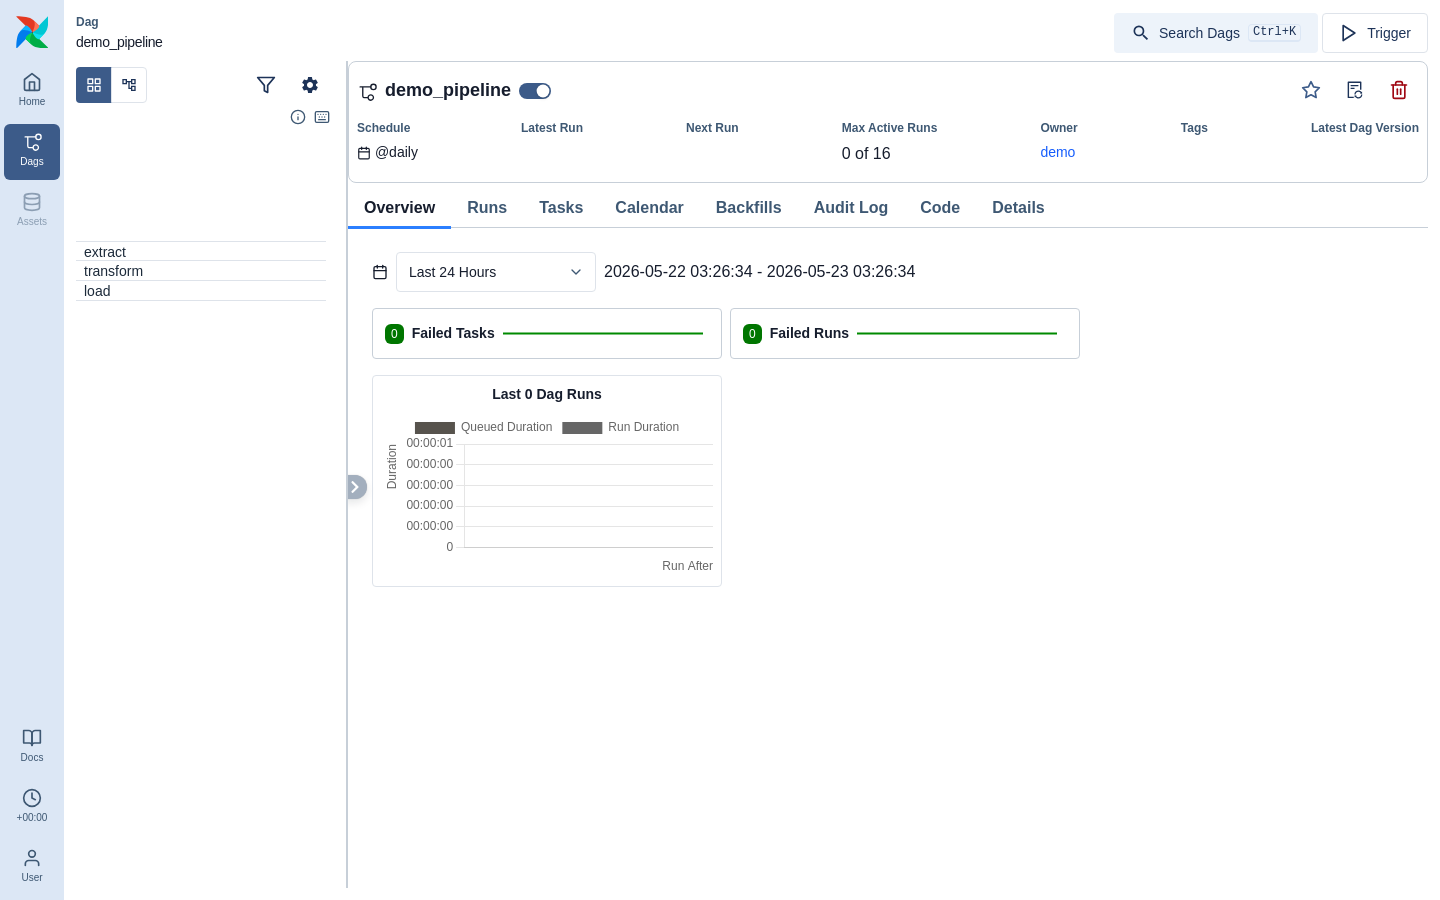
demo_pipeline (no runs) shows its extract/transform/load task rows.
Graph view — ✅ FIXED (was an empty canvas)
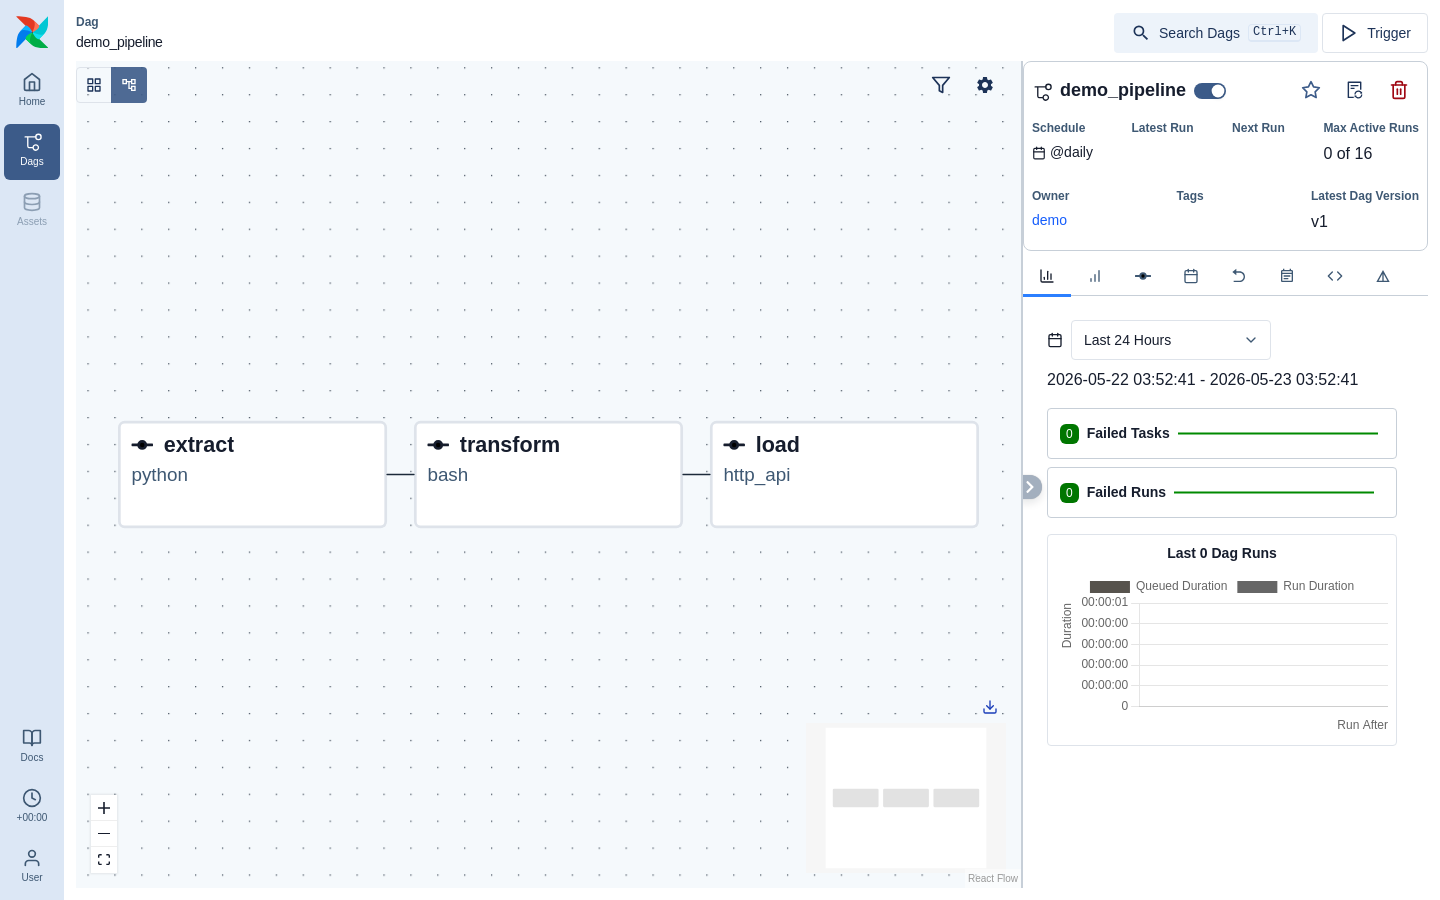
The graph now renders the topology: extract (python) → transform (bash) →
load (http_api) as connected React Flow nodes, with "Latest Dag Version: v1" in
the header.
Root-cause chain (found by diffing against real Airflow 3.2.1 on a side cluster,
not from the SPA prose): the graph fetches
GET /ui/structure/structure_data?dag_id=…&version_number=N — it needs a
version_number. The SPA reads that from GET /api/v2/dags/{id}/details →
latest_dag_version.version_number, which in turn comes from
GET /api/v2/dags/{id}/dagVersions. Both of those 404'd for us, so:
dagVersions 404 → details.latest_dag_version: null → no version_number →
structure_data never fetched → blank canvas.
Fix (this PR):
- Implement GET /api/v2/dags/{id}/dagVersions (real version_number from the
stored versions via a row_number() window — integration-tested against live PG).
- Populate details.latest_dag_version from the version lister.
- Add the optional node/edge fields to structure_data (is_mapped, tooltip,
setup_teardown_type, asset_condition_type; is_setup_teardown, label,
is_source_asset) so the response matches real Airflow exactly.
Verified live in the browser (the screenshot above) and via the captured network
trace (structure_data now returns 200).
Non-2xx requests captured (to stub/implement)
GET /api/v2/dags/{id}/dagRuns/~/taskInstances?…state=failed&order_by=-run_after→ 404. The Overview "Failed Tasks/Failed Runs" widgets poll this (~= all runs). Its failure is why the Overview "Failed Runs" widget shows3for a DAG with 3 successful runs — a visible miscount.GET /api/v2/dags/{id}/dagVersions?order_by=-version_number→ 404. Backs the header "Latest Dag Version" field.GET /api/v2/dags/~/dagRuns(home global run view) → already fixed (degrades to an empty collection).
Other observations
- Sidebar/menu: Home, Dags, Assets, Docs (+ clock, User). Browse and Admin
are correctly hidden by the curated
/ui/auth/menus; Assets is built-in nav, not menu-curated, so it still appears (its pages degrade to empty states). - MIME warning (
Failed to load module script … MIME type "text/html"): upstream Airflow 3.2.1 build artifact, safe to ignore.
Recommended next work
- ~~Fix the empty Graph view~~ — done (dagVersions + details.latest_dag_version
- structure_data fields; see above).
- ~~
dagRuns/~/taskInstancesanddagVersions~~ — done:dagVersionsimplemented; the two~wildcards (dagRuns/~/taskInstances,~/dagRuns) degrade to empty collections (real cross-run/cross-DAG aggregation is a follow-up so the Overview "Failed Runs" widget shows real counts). - Decide whether to hide the Assets nav (it is built-in, not menu-driven).
Note on the external (Antigravity) audit
It is a useful lead generator (it found the ~-wildcard 404s and documented the
write-path payloads), but its schema diagnosis is unreliable: it repeatedly
recommended removing fields that are required by the 3.2.1 spec (verified here —
the list/grid render correctly with them) and its v2 "screenshots" were all 404
pages (bad deep-links). Treat it as a source of leads, validated against the spec
and the browser — which is what this report does.